> ## Documentation Index
> Fetch the complete documentation index at: https://docs.flexprice.io/llms.txt
> Use this file to discover all available pages before exploring further.
# Overview
> Visualize the impact of pricing changes using your real historical data before making them live
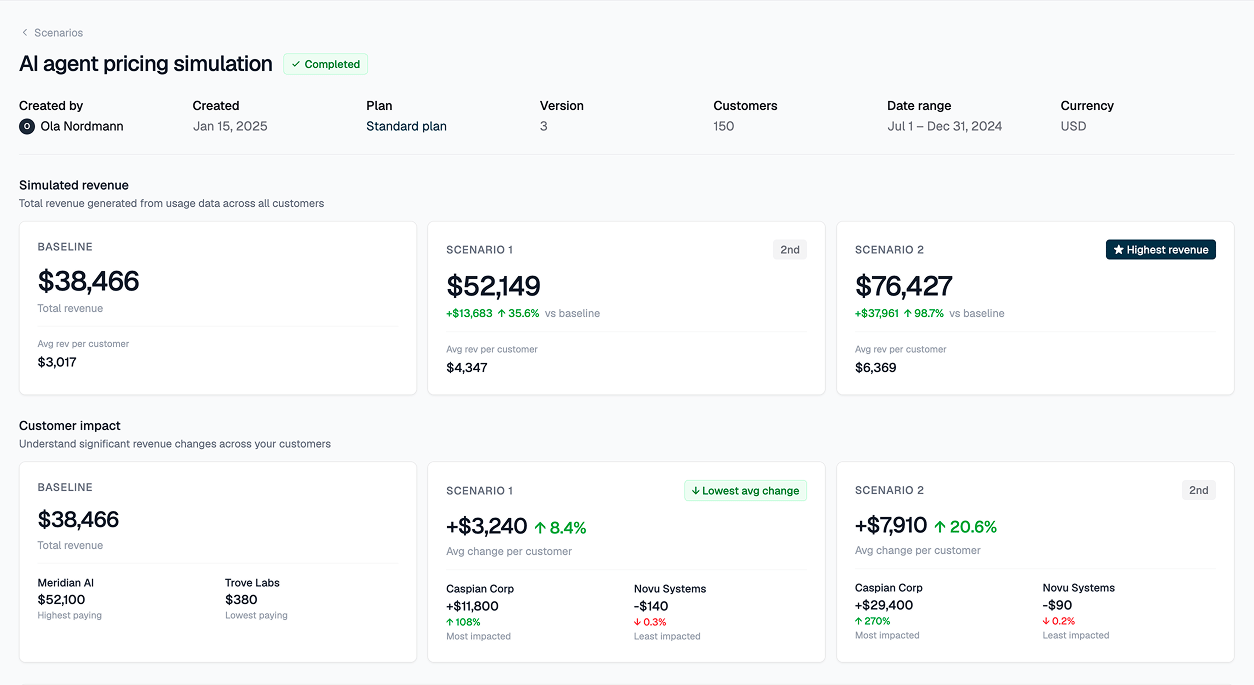
Scenarios let you model price changes in Flexprice before you make them, with none of the billing risk that comes with real-world experimentation. Define the price change you're considering, set your parameters, and Flexprice outputs forecasted revenue, customer impact, and churn guidance using your real historical data, so you can make an informed decision before going live.
Because Flexprice sits at the intersection of your product usage and revenue data, Scenarios are useful for:
* **Backtesting** to de-risk price changes before rolling them out
* **Forecasting** for new product pricing
* **Churn prediction** to identify which customers are most at risk of churning if prices change
 ## Before you start
To use Scenarios, make sure you're up and running with Flexprice. Specifically, you'll need to:
* [**Ingest events**](/docs/event-ingestion/overview): gives Flexprice visibility into your product usage to power the scenario
* [**Define a meter**](/docs/event-ingestion/creating-a-metered-feature): models the specific usage metric the price change applies to
* [**Have a plan with subscriptions**](/docs/subscriptions/customers-create-subscription): defines the customer cohort your scenario will run over
## Creating a scenario
Name your scenario for easy reference, set a historical time frame, and select a plan to run the scenario over. This determines the historical data used in your analysis.
## Before you start
To use Scenarios, make sure you're up and running with Flexprice. Specifically, you'll need to:
* [**Ingest events**](/docs/event-ingestion/overview): gives Flexprice visibility into your product usage to power the scenario
* [**Define a meter**](/docs/event-ingestion/creating-a-metered-feature): models the specific usage metric the price change applies to
* [**Have a plan with subscriptions**](/docs/subscriptions/customers-create-subscription): defines the customer cohort your scenario will run over
## Creating a scenario
Name your scenario for easy reference, set a historical time frame, and select a plan to run the scenario over. This determines the historical data used in your analysis.
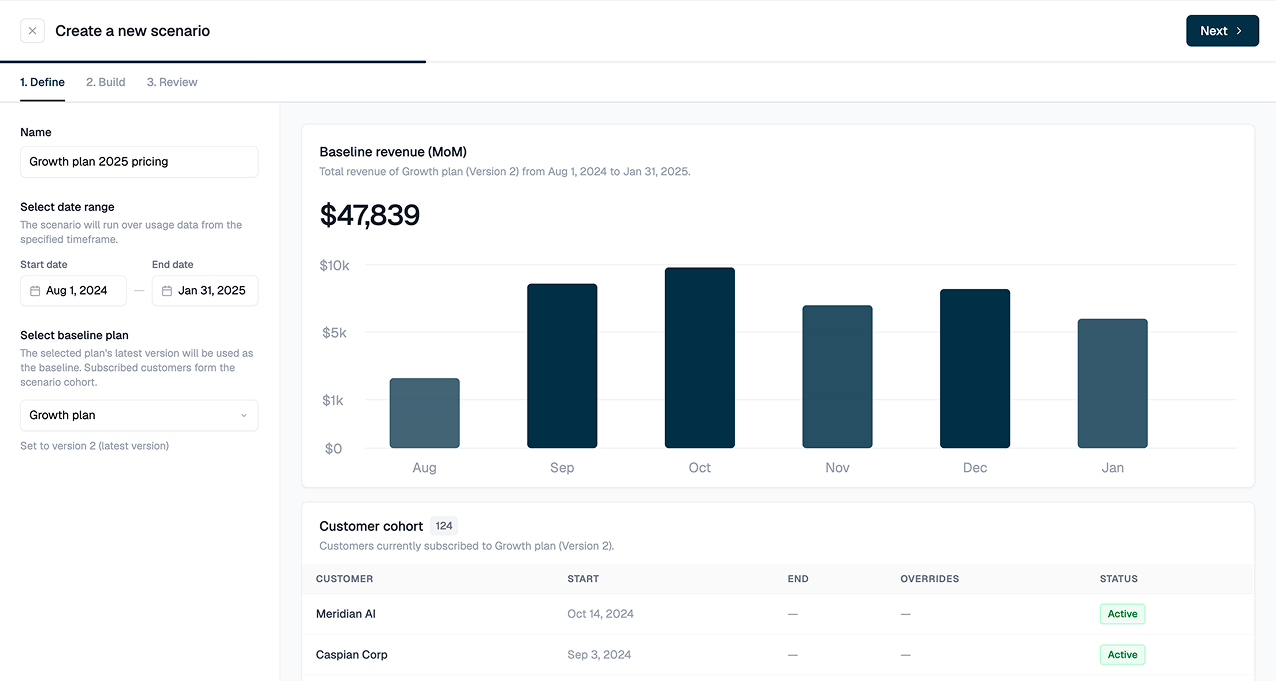 Aim for a window that provides sufficient, representative data. At least 30 to 90 days is recommended for meaningful results. The longer the window, the more visibility you have into customer behavior and seasonal patterns.
A hypothesis represents a hypothetical price change you're considering. Flexprice supports two pricing types:
* **Usage-based prices**: best for modeling prices that scale with variable events: tokens consumed, API calls made, minutes of audio processed.
* **Fixed fee prices**: best for capturing upfront repeatable revenue, such as a platform fee or minimum spend.
A scenario can include one or multiple hypotheses to compare against your baseline. Common setups include:
* **Optimize the price point**: create a hypothesis, duplicate it, and assign different rates to compare
* **Find your value metric**: create one hypothesis per metric candidate to compare them side by side
* **Compare pricing strategies**: model standalone usage-based pricing vs. hybrid usage + fixed fee
* **Compare pricing models**: evaluate unit pricing vs. tiered pricing on the same data
We recommend up to 5 hypotheses per scenario. Beyond that, the results become harder to compare at a glance.
Flexprice runs your scenario against real historical data. You'll receive a notification when results are ready to review.
## Acting on insights
Scenario results are designed to help you decide whether and how to implement your price change. Key revenue and customer risk impacts are surfaced for consideration, replacing the manual spreadsheet alternative.
### Top-line insights
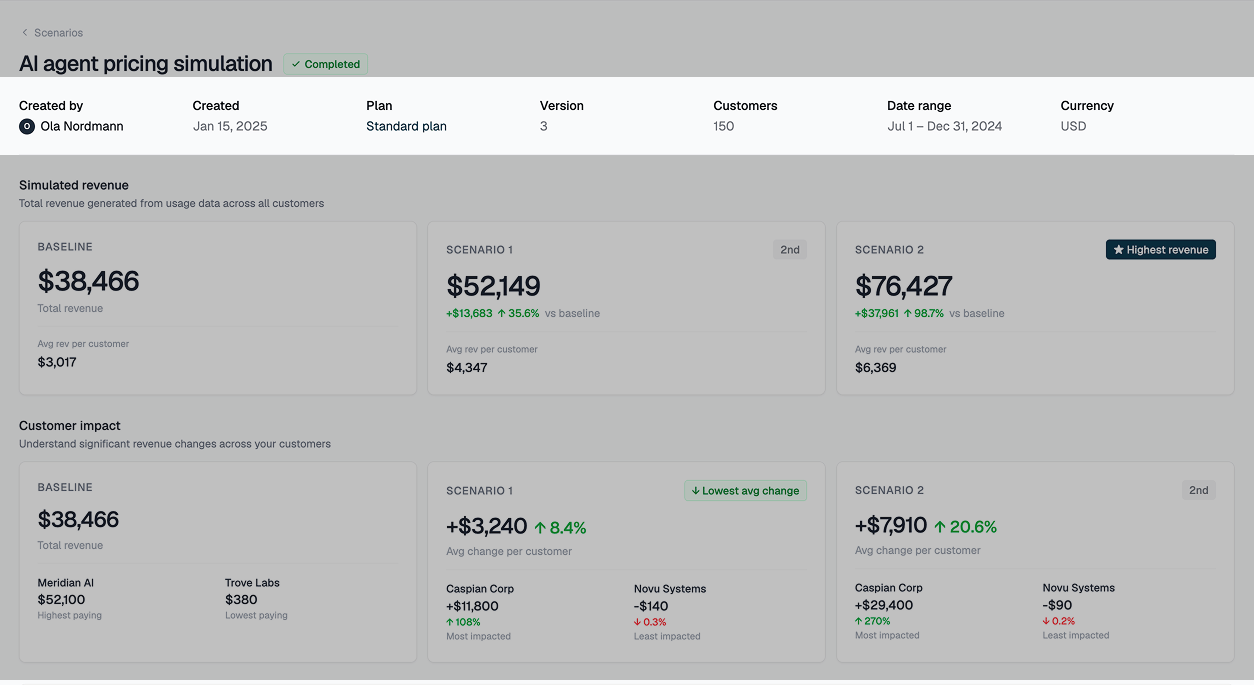
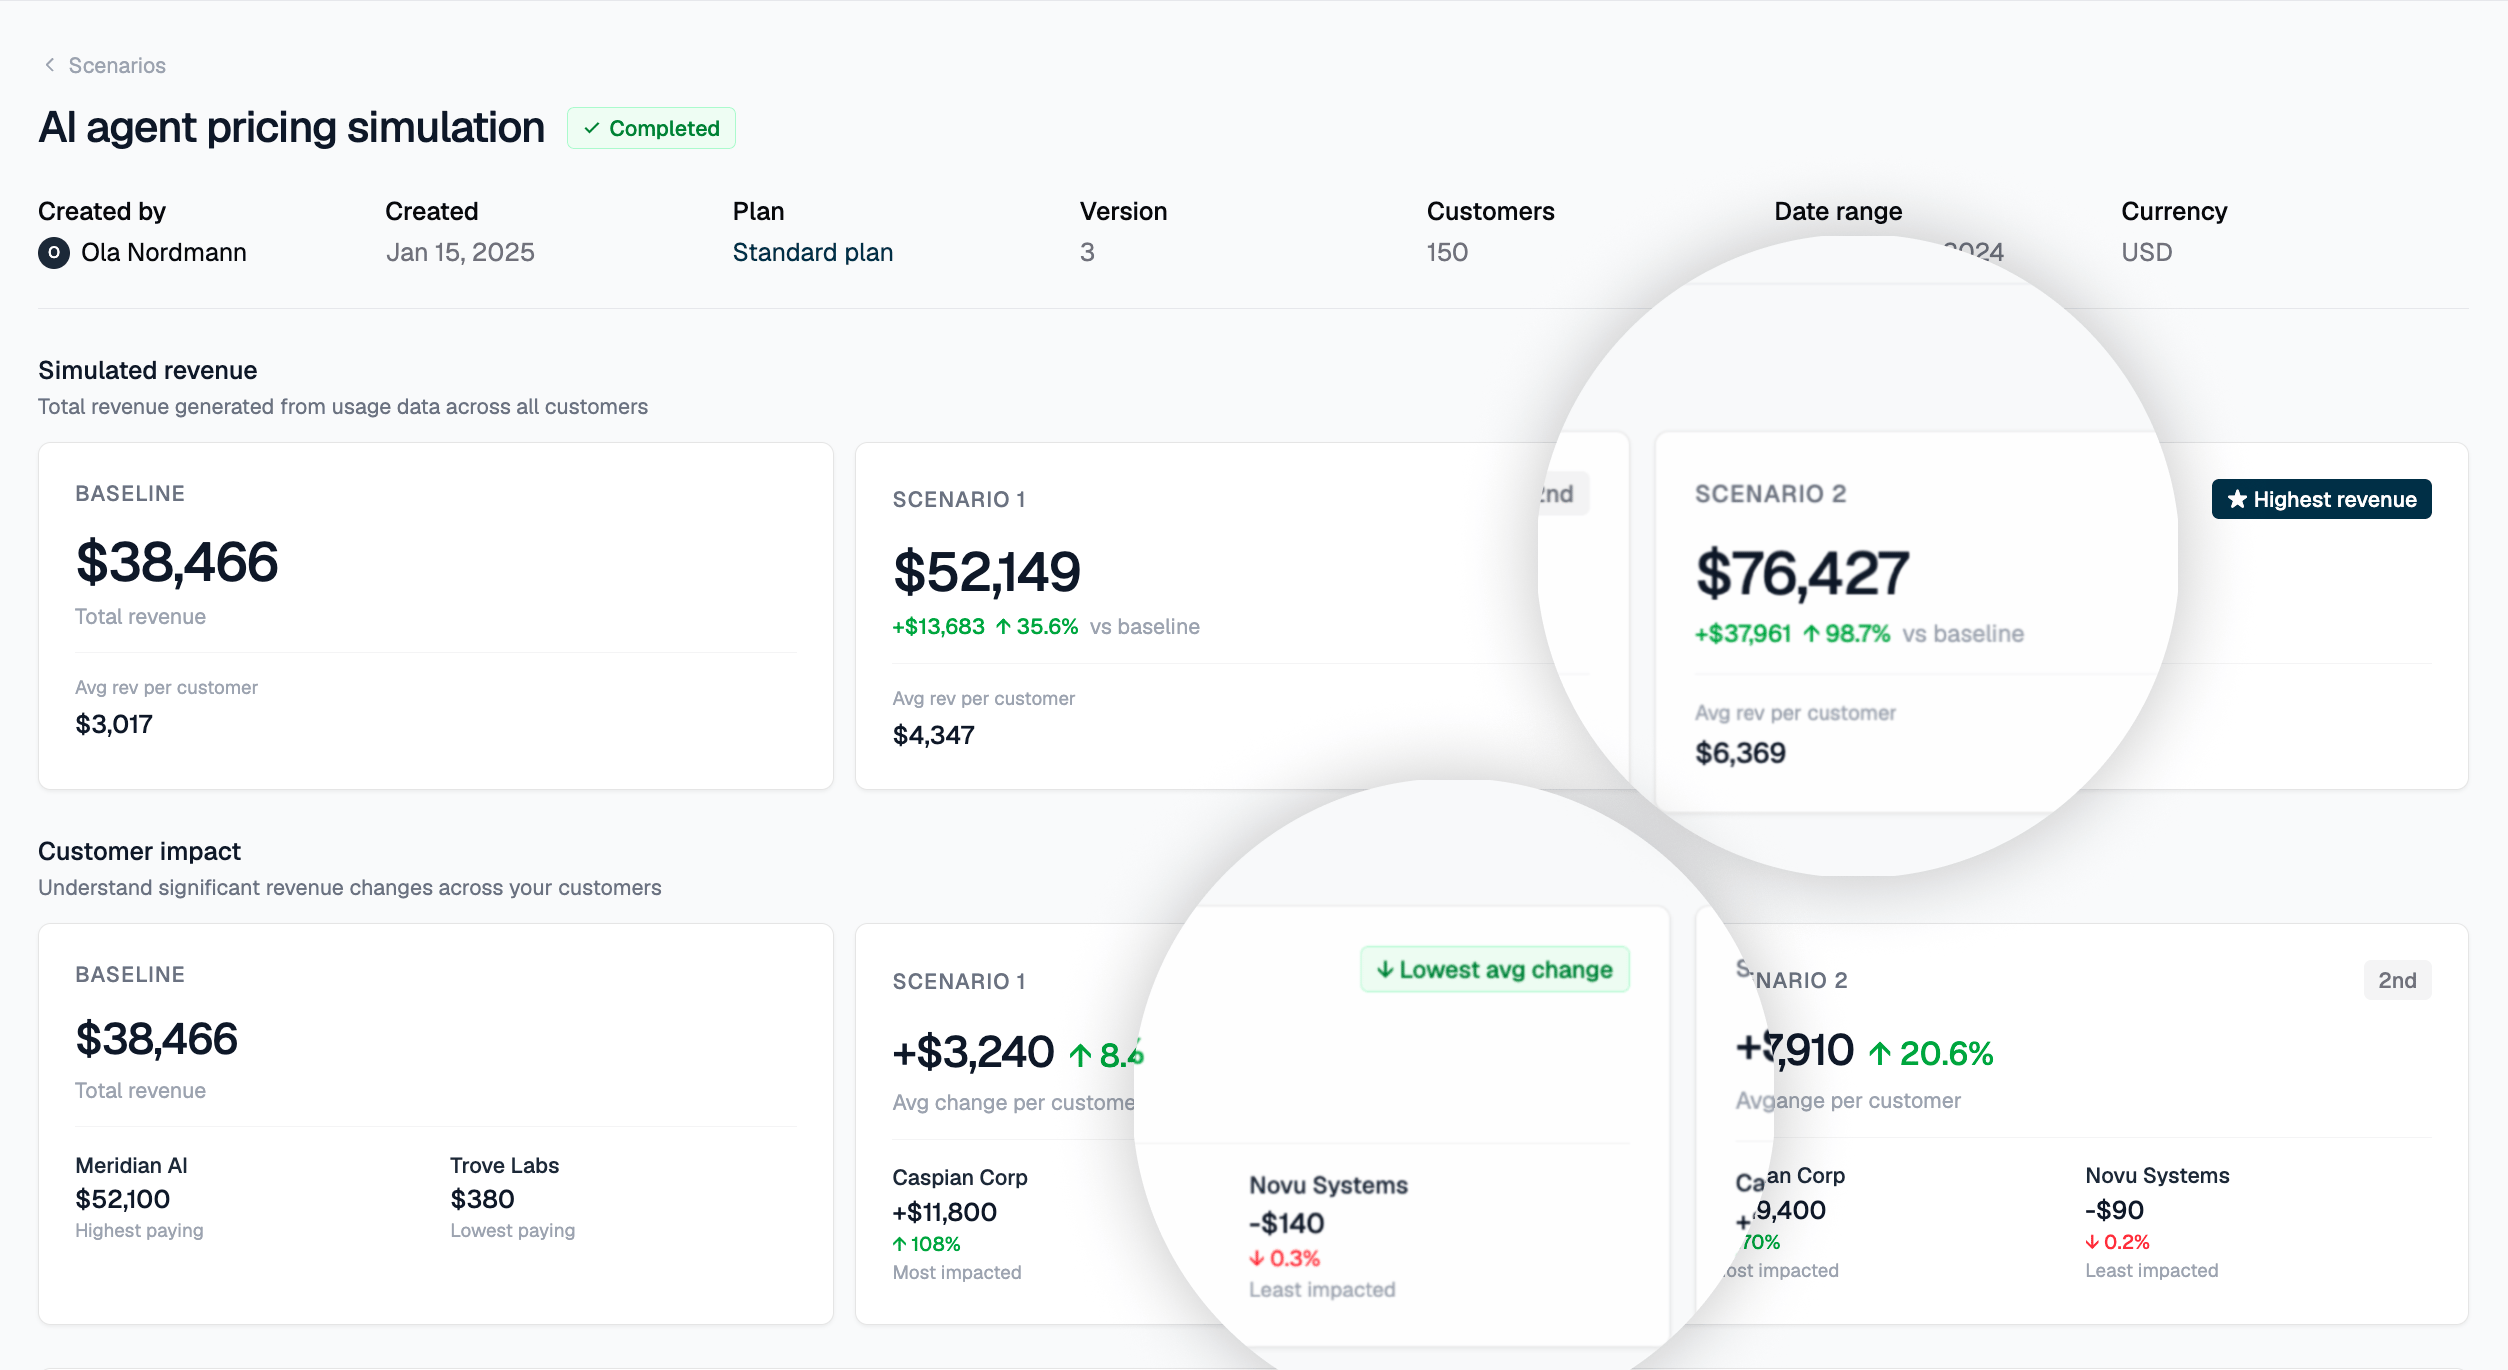
The summary cards highlight the upside potential and downside risk associated with your price change across the customers in your scenario. Flexprice highlights:
* The hypothesis with the **largest absolute revenue increase**
* The hypothesis with the **lowest relative % change** to what customers currently pay
When evaluating a price change, don't optimize purely for revenue uplift. Weigh the risk of price increases on your existing customers, especially your largest ones.
Aim for a window that provides sufficient, representative data. At least 30 to 90 days is recommended for meaningful results. The longer the window, the more visibility you have into customer behavior and seasonal patterns.
A hypothesis represents a hypothetical price change you're considering. Flexprice supports two pricing types:
* **Usage-based prices**: best for modeling prices that scale with variable events: tokens consumed, API calls made, minutes of audio processed.
* **Fixed fee prices**: best for capturing upfront repeatable revenue, such as a platform fee or minimum spend.
A scenario can include one or multiple hypotheses to compare against your baseline. Common setups include:
* **Optimize the price point**: create a hypothesis, duplicate it, and assign different rates to compare
* **Find your value metric**: create one hypothesis per metric candidate to compare them side by side
* **Compare pricing strategies**: model standalone usage-based pricing vs. hybrid usage + fixed fee
* **Compare pricing models**: evaluate unit pricing vs. tiered pricing on the same data
We recommend up to 5 hypotheses per scenario. Beyond that, the results become harder to compare at a glance.
Flexprice runs your scenario against real historical data. You'll receive a notification when results are ready to review.
## Acting on insights
Scenario results are designed to help you decide whether and how to implement your price change. Key revenue and customer risk impacts are surfaced for consideration, replacing the manual spreadsheet alternative.
### Top-line insights
The summary cards highlight the upside potential and downside risk associated with your price change across the customers in your scenario. Flexprice highlights:
* The hypothesis with the **largest absolute revenue increase**
* The hypothesis with the **lowest relative % change** to what customers currently pay
When evaluating a price change, don't optimize purely for revenue uplift. Weigh the risk of price increases on your existing customers, especially your largest ones.
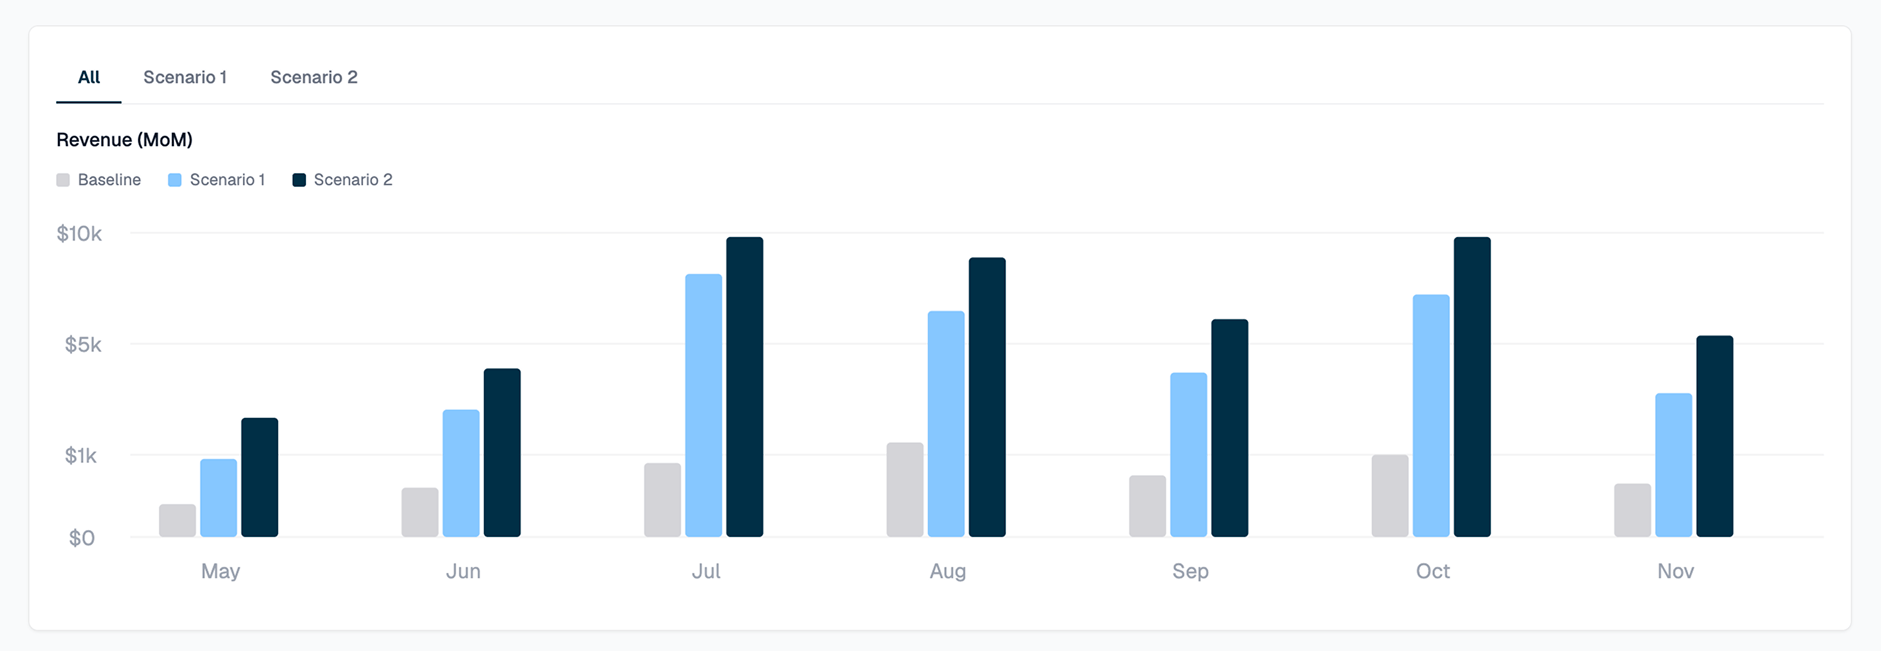
 ### Revenue over time
Monitoring how incremental revenue changes over time across hypotheses helps you:
* Diagnose unexpected revenue variability
* Identify seasonality impacts
* Surface underlying product usage patterns worth considering
Aim for a smooth, consistent revenue curve. Inconsistent spikes may suggest the price change is not aligned with your optimal monetization strategy.
### Revenue over time
Monitoring how incremental revenue changes over time across hypotheses helps you:
* Diagnose unexpected revenue variability
* Identify seasonality impacts
* Surface underlying product usage patterns worth considering
Aim for a smooth, consistent revenue curve. Inconsistent spikes may suggest the price change is not aligned with your optimal monetization strategy.
 ### Impact concentration
Understand where the impact of your price change is concentrated. A $5 increase affects a customer paying $1 very differently from one paying \$100.
Aim for outcomes concentrated in the lower-right of the impact chart: the least relative % change to baseline revenue, with the greatest absolute revenue upside.
### Impact concentration
Understand where the impact of your price change is concentrated. A $5 increase affects a customer paying $1 very differently from one paying \$100.
Aim for outcomes concentrated in the lower-right of the impact chart: the least relative % change to baseline revenue, with the greatest absolute revenue upside.
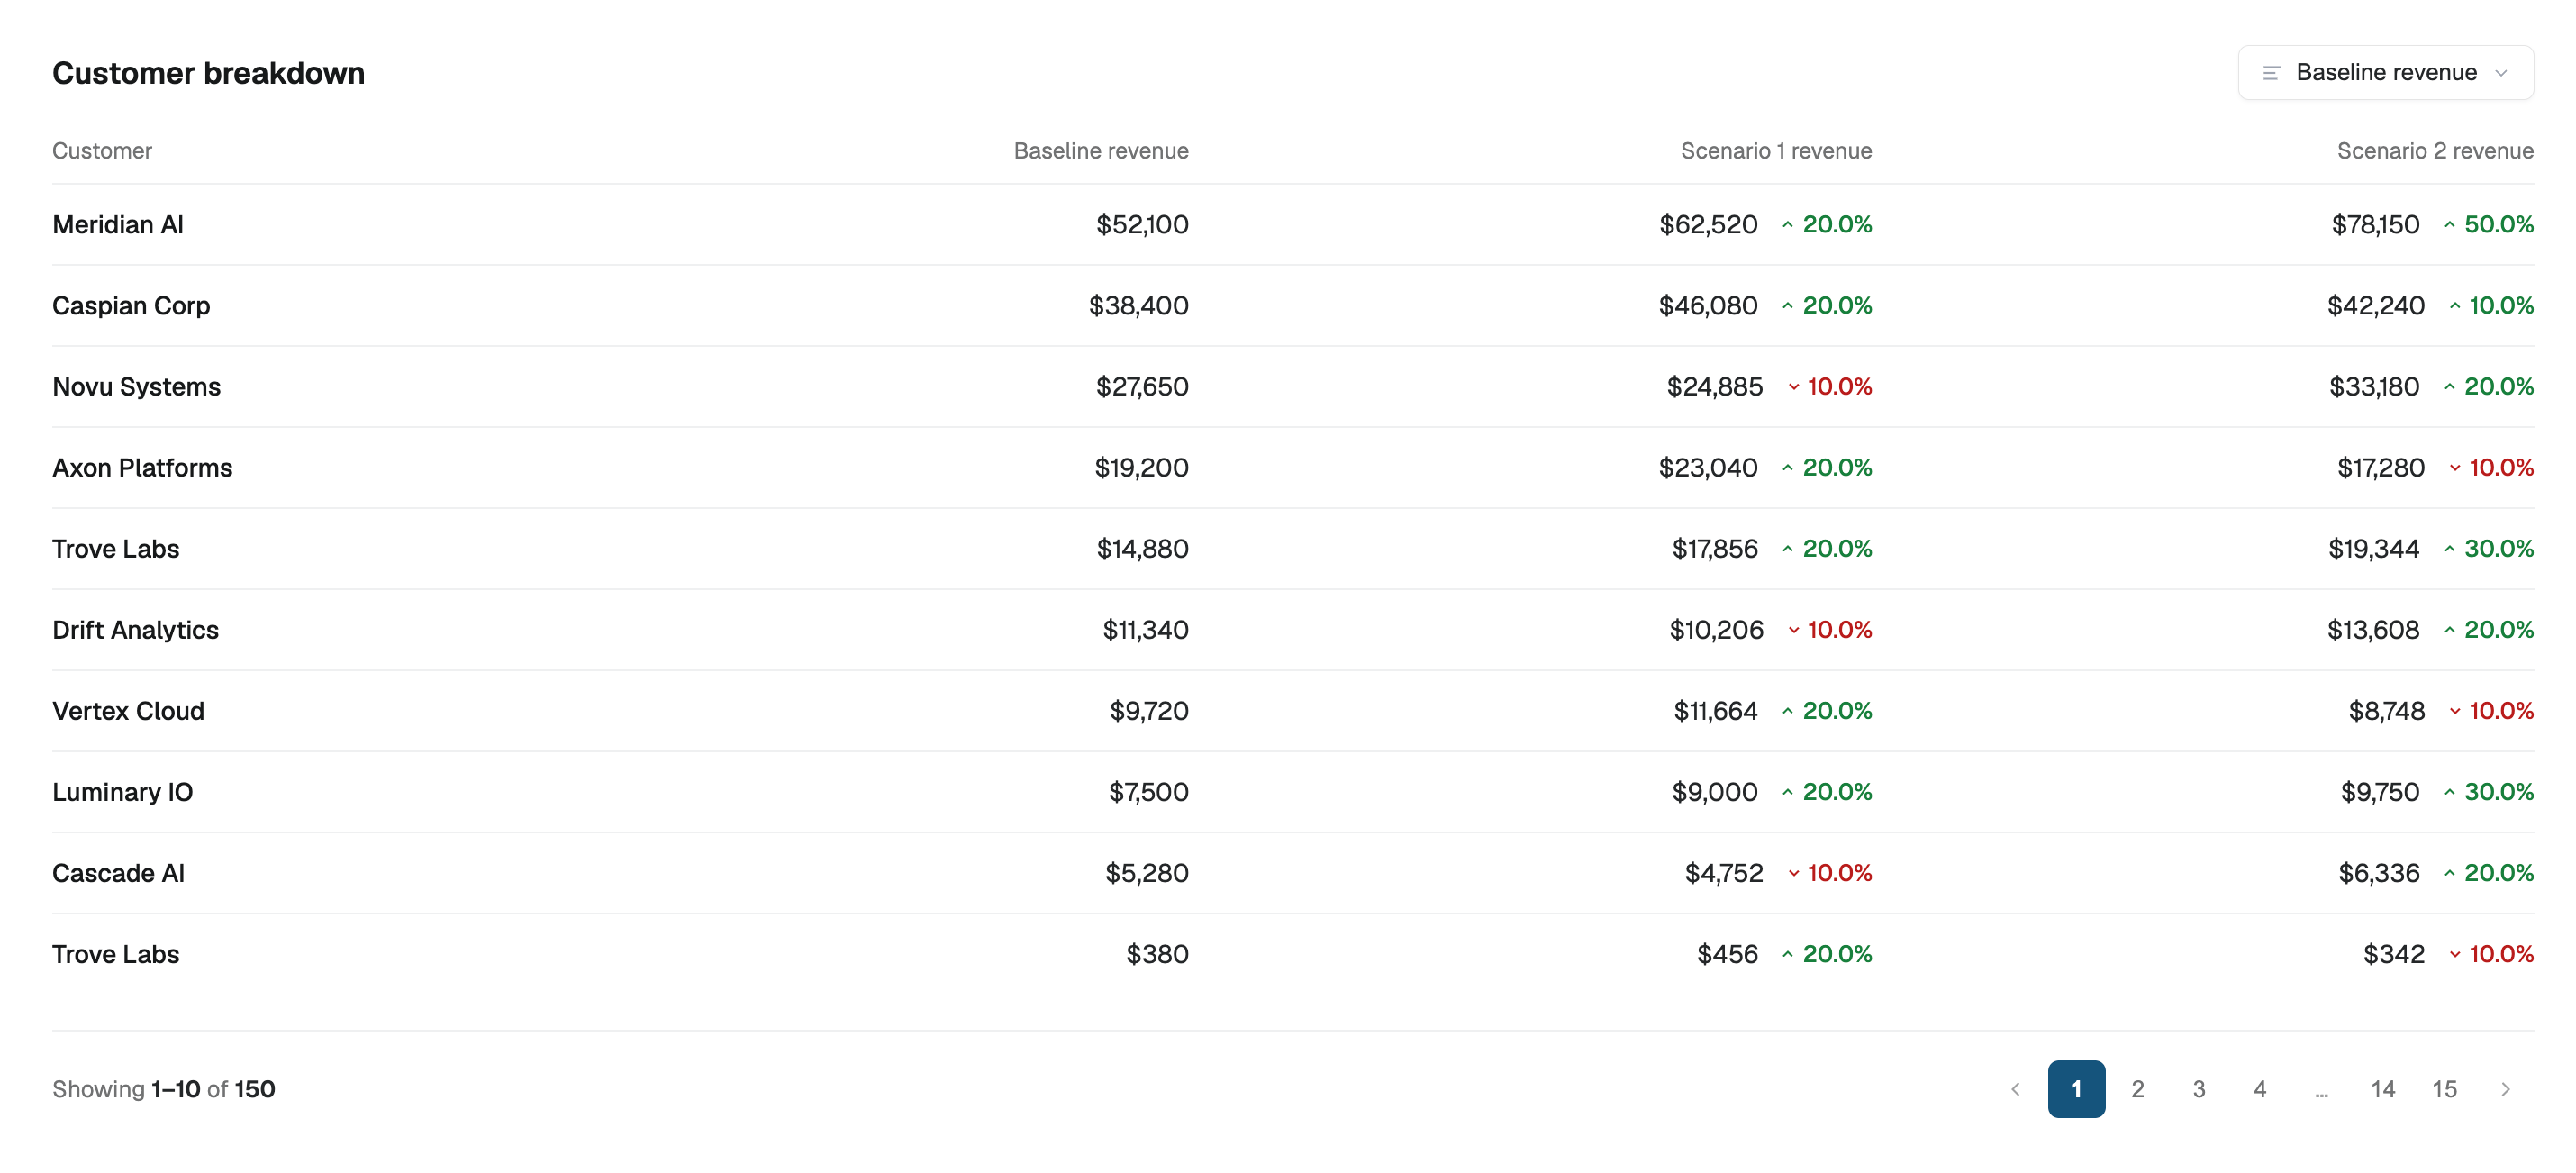
 ### Customer impact table
Proactively identify which customers will be affected by your change. Get ahead of notifying your customer-facing teams before the change goes live. From this table, you can:
* Review [historical subscriptions and invoices](/docs/subscriptions/view) to understand customer LTV
* Create a [price override](/docs/product-catalogue/plans/price-overrides) to accommodate exceptions
* Migrate affected customers to a new plan version while grandfathering marquee accounts on existing pricing
### Customer impact table
Proactively identify which customers will be affected by your change. Get ahead of notifying your customer-facing teams before the change goes live. From this table, you can:
* Review [historical subscriptions and invoices](/docs/subscriptions/view) to understand customer LTV
* Create a [price override](/docs/product-catalogue/plans/price-overrides) to accommodate exceptions
* Migrate affected customers to a new plan version while grandfathering marquee accounts on existing pricing
 ## Explore use cases